In 2025, the University of the Cordilleras’ Campus Management Office (CMO) completed 11 infrastructure projects, reached 100% LED lighting across all eight campus buildings, and supplied 17,847 m³ of recycled water for non-potable campus use. The work spans two units: the Engineering, Architecture and Technical Unit, and the Campus Compliance & Pollution Control Officers Unit.
The figures below summarize the year’s sustainability performance, drawn from the CMO Annual Report 2025.
| Indicator | 2025 result |
| Infrastructure projects completed | 11 |
| Potable water from Baguio Water District | 33,087 m³ (1.66 m³ per person) |
| Recycled water used on campus | 17,847 m³ (about 35% of all water used) |
| Sewage treatment plant capacity | 1,200 m³ per day |
| Organic waste generated | 12.62 tons |
| Inorganic waste generated | 13.48 tons |
| Recyclables recovered | 3.39 tons (25% of inorganic waste) |
| Hazardous waste collected | 1.90 tons (0.24 tons treated) |
| Electricity consumed | 1,078,524 kWh |
| LED lighting conversion | 100% (5,121 fixtures reported in 8 buildings) |
Infrastructure that lasts
The Engineering, Architecture and Technical Unit completed 11 projects in 2025, focused on keeping existing buildings safe, resilient and useful rather than replacing them. The work supports SDG 4 (Quality Education), SDG 9 (Industry, Innovation and Infrastructure), SDG 11 (Sustainable Cities and Communities) and SDG 12 (Responsible Consumption and Production).
| # | Project | Scope | Sustainability contribution |
| 1 | Replacement and improvement of roll-up gates and windows | Motorized and manual roll-up systems; sliding, awning and fixed windows; window grilles at the CHTM Building, Science Building, CCJE Library (Legarda Campus) and Chemistry Apparatus Supply Room | Safer, more functional, better-maintained facilities |
| 2 | Structural testing program | Main and Science Buildings: rebound hammer testing, ferro scanning, coring and compression testing of columns, beams and slabs | Evidence for informed maintenance and resilient structures |
| 3 | Repair and painting works | Executive and Presidential Staff Houses: roofing repairs and replacement, wall repainting, eaves and ceilings, waterproofing, polycarbonate sheets, cabinet fabrication, gate repair and repainting | Extends the life of existing buildings and protects them from weather exposure |
| 4 | Wall backing for LED wall installations | Theater, Auditorium and Gate 1: wall backing and covers, plus an ACP shed and sidings at Gate 1 | Supports modernized spaces |
| 5 | LED wall panel systems | Auditorium, Theater and Gate 1 | Digital displays for teaching, programs and events |
| 6 | Renovation of BENSA Publishing House and ESSI Administrative Office | Offices, hallways, huddle rooms, comfort rooms, reception and storage areas, maintenance and server rooms, medical clinic, machinery and printing/publishing rooms, and other common areas | More effective workspaces |
| 7 | Furniture fabrication | College of Accountancy academic and administrative spaces | Functional learning environments |
| 8 | Rerouting of storm drainpipe and floor drain | Drainage within the affected facility | Better water flow management |
| 9 | Renovation of the CONAHS Laboratory | CONAHS Laboratory | Improved space for practical laboratory learning |
| 10 | Construction of wall opening | Main Kitchen | Improved function and accessibility |
| 11 | Structural testing | Main Building, Legarda Campus | Data to plan safe, resilient upkeep |
In-house and preventive maintenance
Alongside capital projects, in-house teams keep existing facilities in good working order:
- Janitorial services keep all campus buildings clean, hygienic and safe.
- Carpentry works handle routine repairs of wooden structures and furniture.
- Painting services maintain protective finishes that prevent deterioration.
- Electrical works cover routine inspections, troubleshooting and upgrades.
Preventive maintenance of mechanical and electrical systems keeps equipment in optimal condition. This extends facility life, reduces disruptions and supports energy-efficient performance.
Building a greener future
Through long-lasting materials, efficient systems and preventive maintenance, the year’s projects support lower energy use, less water waste, longer building lifespans, better health and safety, and greater climate resilience and resource efficiency.
Campo Libertad: a green flagship
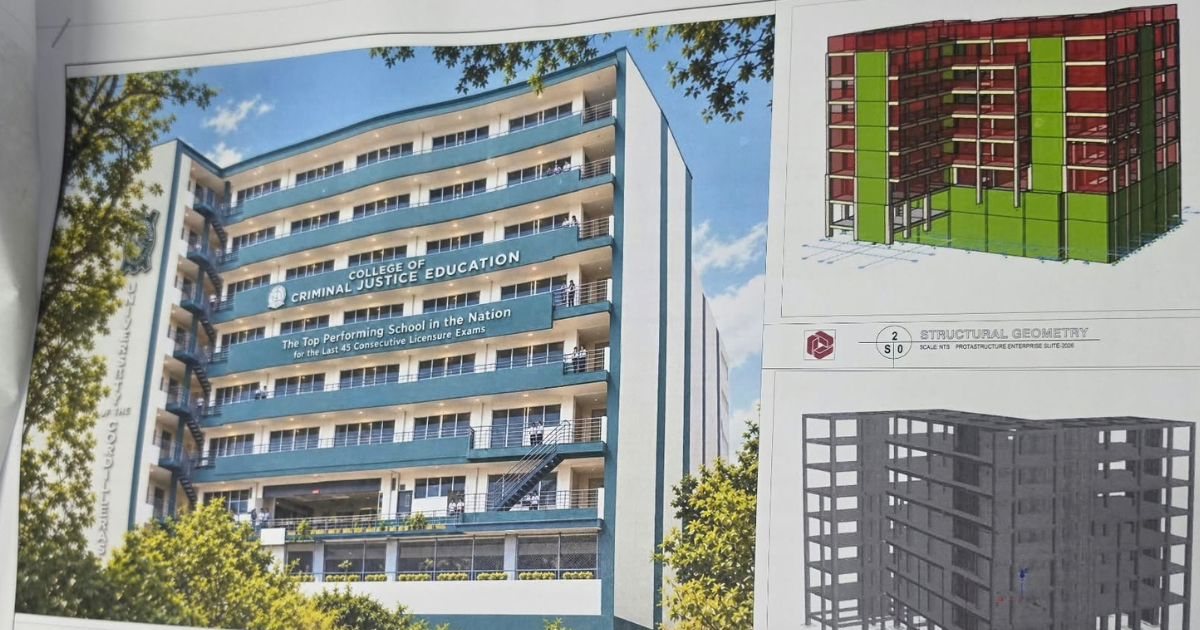
The 10-storey Campo Libertad campus remains under construction; its latest milestone is the completion of concrete pouring for the beams and the 10th-floor slab. Three resource-saving systems are built into the design:
- Rooftop solar panels for renewable power
- Rainwater harvesting for non-potable uses
- A sewage treatment plant for responsible wastewater handling
Next: solar power for the Main Campus
Plans are underway to install solar panels across the Main Campus to move the University toward long-term energy independence. Expected benefits are lower energy costs, more clean energy, lower carbon emissions and progress toward green campus certification.
Pedestrians first
In line with Baguio City’s “King of the Road” Ordinance No. 7, s. 2010, vehicles on campus make a full five-second stop when pedestrians are present or approaching, and pedestrian lanes stay clear of vehicles. The only exceptions are police-directed crossings and emergency vehicles responding to actual emergencies.
Designated loading and unloading zones around the University keep pedestrians safe and reduce congestion near entrances. Hallways are regularly cleared and monitored to keep daily flow smooth and allow quick evacuation in emergencies.
Water: treat, reuse, conserve
The University drew 33,087 m³ of potable water from the Baguio Water District (BAWADI) in 2025, or 1.66 m³ per person across a campus population of 19,905. It also reused 17,847 m³ of recycled water, so roughly one in every three cubic meters used on campus did not come from the city supply.

CMO Annual Report 2025 · monthly water use, Jan–Dec 2025
Potable use peaked in October (3,523 m³) and was lowest in July (1,966 m³). Recycled water peaked in August (1,971 m³) and July (1,830 m³); in July it nearly matched the potable draw.
How the water system works
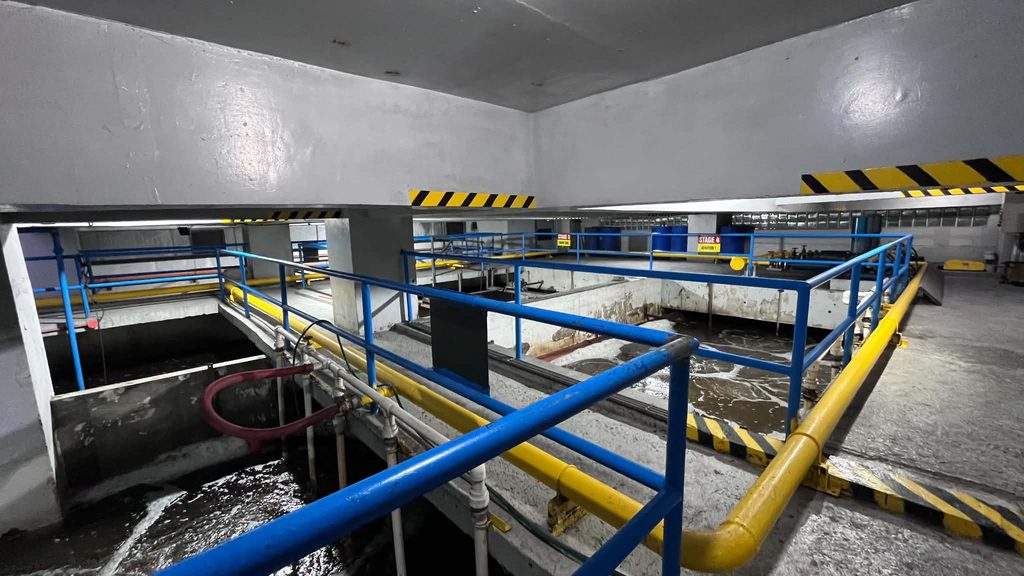
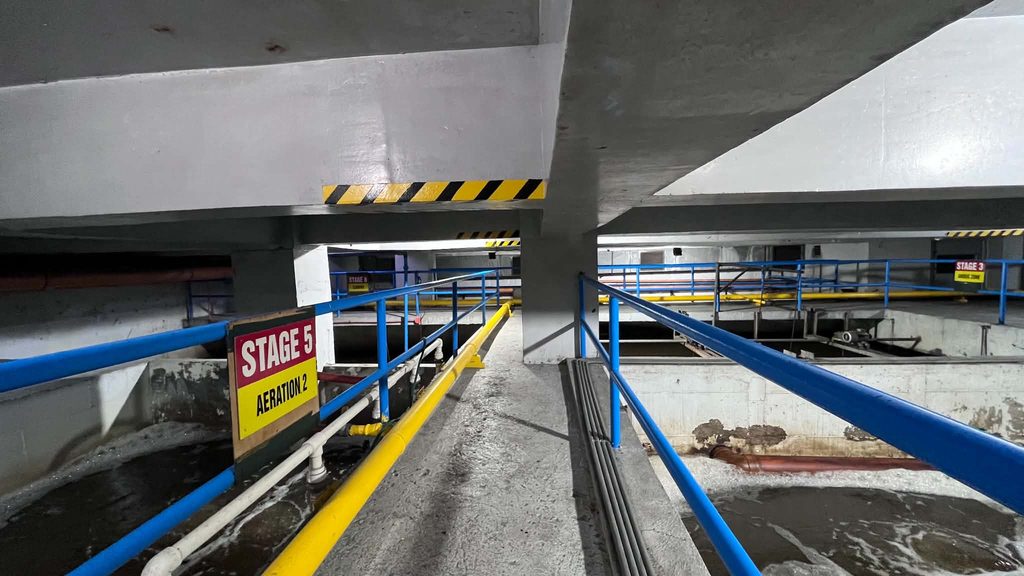
Sewage treatment plant (STP). A 1,200 m³-per-day plant treats wastewater from toilets, urinals, sinks and lavatories.
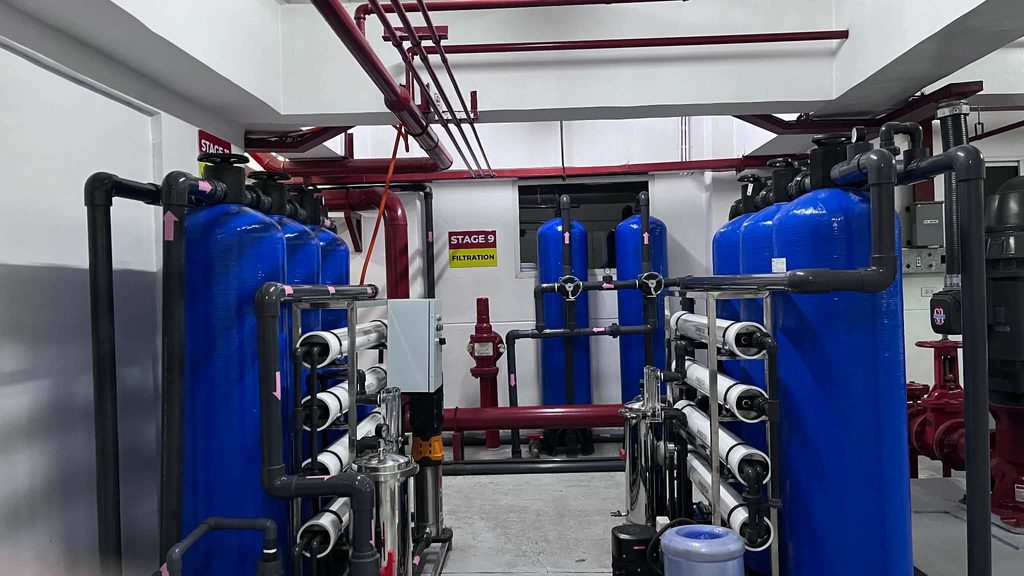
Reverse osmosis (RO). A final RO filtration stage removes residual impurities so treated water can be safely reused for non-potable purposes.
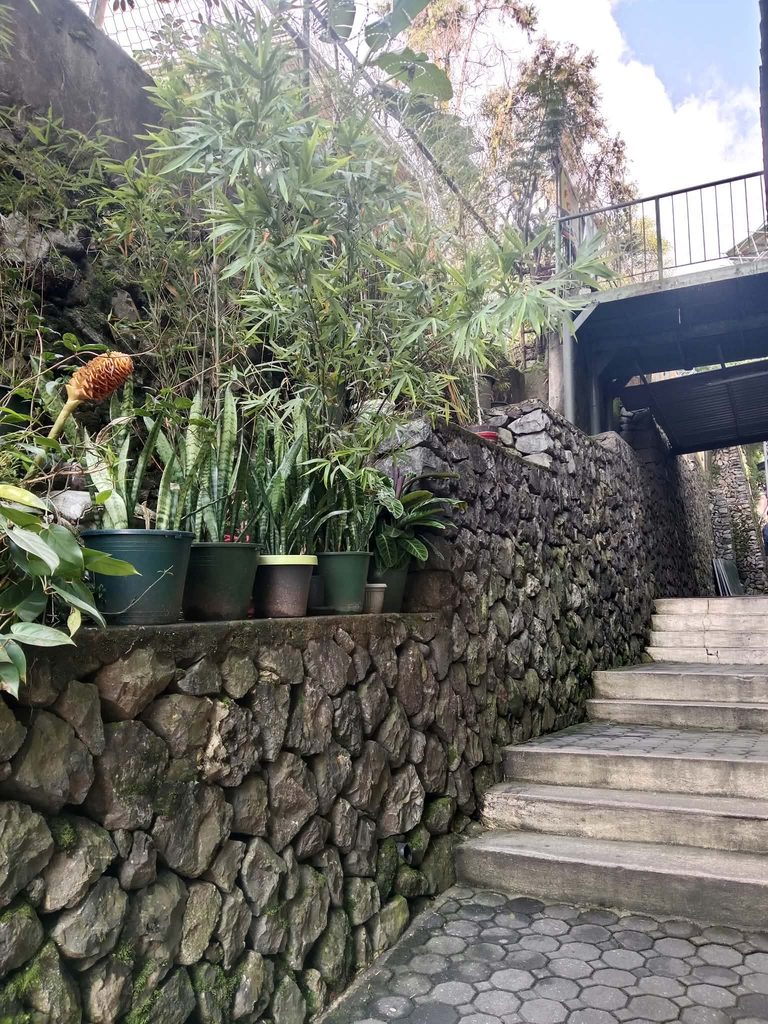
Reuse. Treated wastewater flushes toilets and waters campus plants and landscaping, significantly reducing potable water demand.
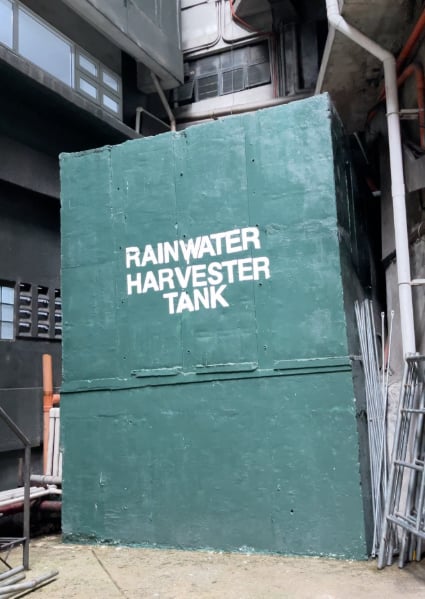
Rainwater harvesting. The rainwater harvester tank collects rooftop rainwater, which is filtered, stored in non-potable tanks and combined with recycled wastewater.
Water-efficient buildings and landscaping
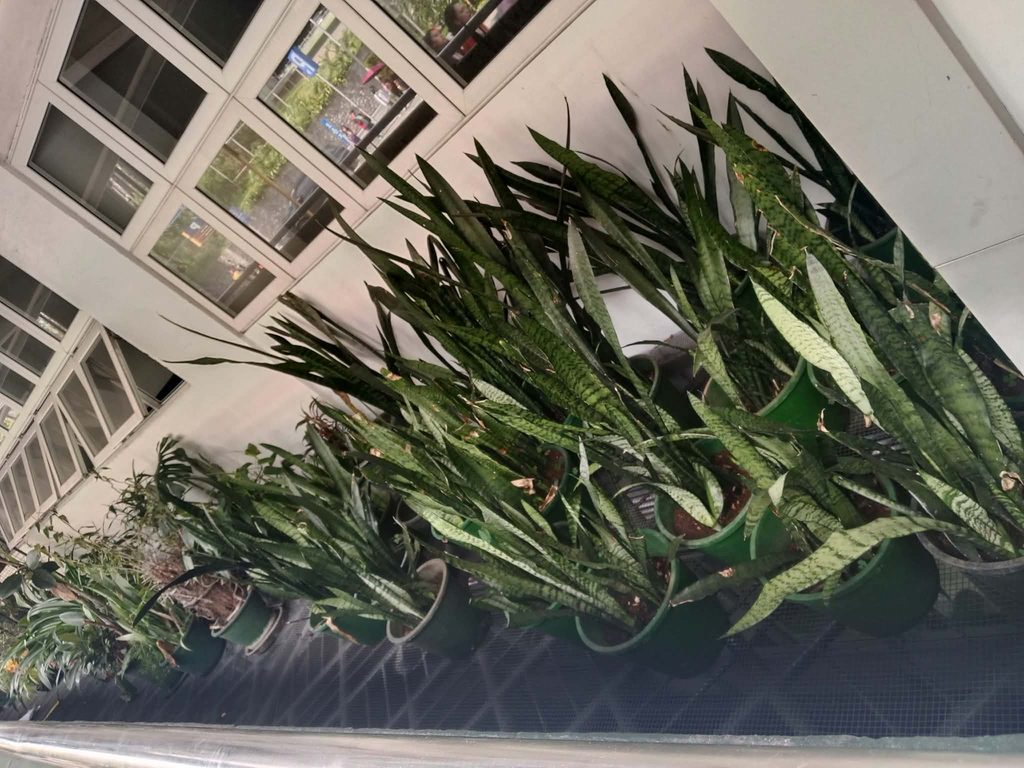
Water-saving plumbing fixtures and regular inspection of distribution lines help prevent leaks and waste. Campus grounds use drought-tolerant, locally suitable plants, scheduled irrigation and, where appropriate, harvested rainwater and treated wastewater instead of potable water.
Compliance and safety
JPBanosan Construction and a Buildings Maintenance Office technician carry out routine inspections and preventive maintenance of STP equipment, including pumps, filtration units and the RO system. Effluent is sampled quarterly to meet DENR Administrative Order No. 2016-06 (Water Quality Guidelines and General Effluent Standards of 2016). The Environmental Management Bureau has issued the University a Discharge Permit under RA 9275, the Philippine Clean Water Act.
Seven drinking fountains serve the community: five at the Main Campus and two at the Legarda Campus. The water undergoes quarterly microbiological analysis, and the fountains receive regular preventive maintenance.
Waste: sort, recover, dispose safely
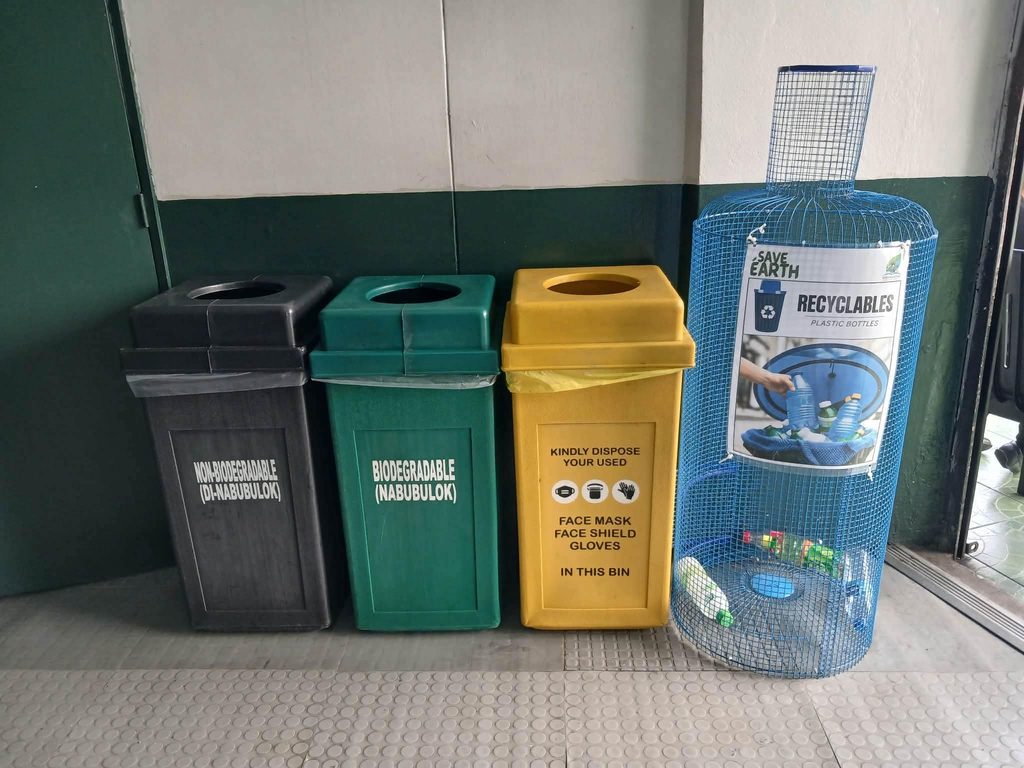
The campus generated about 28 tons of waste in 2025: 12.62 tons organic, 13.48 tons inorganic and 1.90 tons hazardous. Waste is segregated at the point of disposal through designated hallway bins, so each stream reaches the right destination.
Organic waste
Housekeeping staff collect organic waste from hallway bins and bring it to the campus vermicomposting area, producing nutrient-rich compost for gardening and landscaping. Canteen leftovers are sold to employees as food for their pets, while tissues and crumpled paper go to the garbage collection area for city disposal.
| Type of organic waste | Produced (tons/year) | Destination |
| Food waste and vegetable peelings | 11.000 | Vermicomposting; canteen leftovers sold to employees as pet food |
| Others (tissues, crumpled paper) | 1.387 | City collection |
| Leaves and vegetation | 0.232 | Vermicomposting |
| Total | 12.619 |
Inorganic waste
Recyclables are separated from residuals, turned over to the Logistics Management Office and sold to local junk shops. This keeps 3.39 tons of material out of landfill and feeds it back into a circular economy.
| Type of inorganic waste | Produced (tons/year) | Stream |
| Residuals | 10.089 | Disposal |
| Paper | 1.986 | Recycled |
| Monoblock (plastic furniture) | 0.492 | Recycled |
| Flat sheets | 0.474 | Recycled |
| Metals | 0.220 | Recycled |
| Empty boxes | 0.166 | Recycled |
| Plastic bottles | 0.045 | Recycled |
| Stainless | 0.009 | Recycled |
| Aluminum | 0.002 | Recycled |
| Total | 13.483 |
Paper is the largest recovered stream at nearly 2 tons, followed by monoblocks and flat sheets.
Hazardous waste
Waste electrical and electronic equipment, laboratory chemicals from student experiments, pathological waste from the medical clinic and nursing laboratory, and paint cans go to the Logistics Management Office for inventory. The Pollution Control Officer then labels them, and an EMB-accredited hazardous waste treater handles final disposal in line with regulatory standards.
| Type of hazardous waste | Collected (tons) | Treated (tons) |
| Waste electrical and electronic equipment (WEEE) | 1.0825 | 0.2060 |
| Containers that held toxic chemicals | 0.4179 | 0.0185 |
| Laboratory chemicals | 0.2846 | 0.0072 |
| Pathological wastes | 0.1180 | 0.0055 |
| Total | 1.9030 | 0.2373 |
About 12% of collected hazardous waste (0.24 of 1.90 tons) had been treated by the accredited treater during the reporting period.
Energy: every light is now LED
The University used 1,078,524 kWh of electricity in 2025, about 94% of its total energy use, and completed a 100% switch to LED lighting. Electricity powers lighting, power outlets, elevators, mechanical equipment and the laboratories that support science and engineering programs at the Main and Legarda Campuses.
| Energy source | 2025 usage (kWh, as reported) |
| Electricity | 1,078,524.00 |
| Diesel | 47,398.19 |
| LPG | 4,688.58 |
| Gasoline | 3,062.89 |
Three building groups account for 97% of significant energy use, which shows the 2026 energy audit where to look first.
| Building group | Share of energy use |
| CHTM / BRS / PE | 37% |
| Main Building / Science Building | 33% |
| EDS | 27% |
| Legarda Campus | 3% |
LED conversion complete
As of December 20, 2025, every light fixture in all eight buildings is LED, with no fluorescent or incandescent lights remaining. LEDs can cut lighting electricity use by 50–70%, last longer and need less maintenance, which also means less waste.
| Building | LED lights | Fluorescent lights | LED share |
| Science Building (SB) | 1,353 | 0 | 100% |
| Main Building (MB) | 924 | 0 | 100% |
| EDS | 840 | 0 | 100% |
| CHTM | 681 | 0 | 100% |
| BRS | 574 | 0 | 100% |
| Legarda | 492 | 0 | 100% |
| PE | 215 | 0 | 100% |
| Gymnasium | 89 | 0 | 100% |
| Total (as reported) | 5,121 | 0 | 100% |
Every department plays a part
The University’s energy management approach asks each department to review its own consumption patterns and find savings, through measures such as improved insulation, LED lighting and sustainable technologies.
Baguio’s climate advantage
Baguio’s cool temperatures and balanced humidity reduce the need for mechanical heating and cooling, unlike much of the tropical Philippines. The University uses this natural comfort to keep energy-intensive systems to a minimum.
Coming in 2026: a full energy audit
A comprehensive energy audit in 2026 will assess existing conservation measures, validate significant energy uses and identify new options for renewables and cost savings. Its results will guide investment and policy toward a carbon-neutral campus. The LED program and the audit support SDG 7 (Affordable and Clean Energy), SDG 12 and SDG 13 (Climate Action).
Looking ahead
The CMO’s next steps aim at a carbon-neutral, resource-efficient campus: finishing Campo Libertad with solar power, rainwater harvesting and on-site sewage treatment; installing solar panels on the Main Campus; and running a full energy audit in 2026. Together with the LED conversion, water reuse and waste recovery already in place, these efforts advance the University’s commitments under the SDGs.
| SDG | How the CMO contributes |
| SDG 4 Quality Education | Renovated CONAHS Laboratory, College of Accountancy furniture, LED wall systems for learning and events |
| SDG 6 Clean Water and Sanitation | STP with RO treatment, 17,847 m³ of water reused, rainwater harvesting, quarterly-tested drinking water |
| SDG 7 Affordable and Clean Energy | 100% LED lighting, planned Main Campus solar, 2026 energy audit |
| SDG 9 Industry, Innovation and Infrastructure | Structural testing, resilient upgrades, preventive maintenance |
| SDG 11 Sustainable Cities and Communities | Pedestrian-first mobility, drainage improvements, safe facilities |
| SDG 12 Responsible Consumption and Production | Waste segregation, vermicomposting, recycling, accredited hazardous waste treatment |
| SDG 13 Climate Action | Lower electricity demand, renewable energy plans, climate-resilient buildings |
SDG 6 is added based on the water and sanitation programs described in the report; the report itself cites SDGs 4, 7, 9, 11, 12 and 13.
Data notes: the report gives electricity as 93.96% of energy use; the four kWh figures listed compute to about 95%. The report states a total of 5,121 LED fixtures, but its per-building counts add up to 5,168.
Source: Campus Management Office, University of the Cordilleras, Annual Report 2025. Prepared by Engr. Felina Kate B. Laongan (Compliance and Pollution Control Officer), reviewed by Engr. Ranillo M. Masilungan (CMO Assistant Director), approved by Roselyn M. Gama (CMO Director).